WYChart 0.3.1
| TestsTested | ✗ |
| LangLanguage | Obj-CObjective C |
| License | MIT |
| ReleasedLast Release | Feb 2017 |
Maintained by GeorgeWang.
WYChart 0.3.1
- By
- FreedomKing
A simple and elegant LineChart and pieChart library with rich animations. More type of charts will come not long after.

WYLineChart
Make it easy to create a line chart, Scrollable, Pinchable, Animatable
WYPieChart
Make it easy to create a Pie chart, Rotatable, Draggable, Selectable, Animatable

WYRadarChart
Make it easy to create a Radar chart, Animatable
With a period of time, WYChart version 0.2.0 has been released, it support mutiple lien in lineChart.
If you love WYChart , encourage me with a star
如果你喜欢WYChart , 给我一个星星
另外,关于WYChart技术及其它介绍的博文已开始撰写并逐步发布,
中文简介请点击 👉 中文简介
Project
Requirements
WYChart works on iOS7+, compatible with ARC. Some Framework are required, as follow:
- Foundation.framework
- UIKit.framework
- QuartzCore.framework
- CoreGraphic.framework
The frameworks above always included in most xcode project.
License
WYChart is available under the MIT license. See the LICENSE file for more info.
Demo
The Project included a demo showing the tow chart and the code that how to use the chart with properties and methods.In perticalculer, there are setting pages for two charts which you can change the property and see what changed.
To run the example project, clone the repo, and run pod install from the Example directory first.
The demo page shows follow:
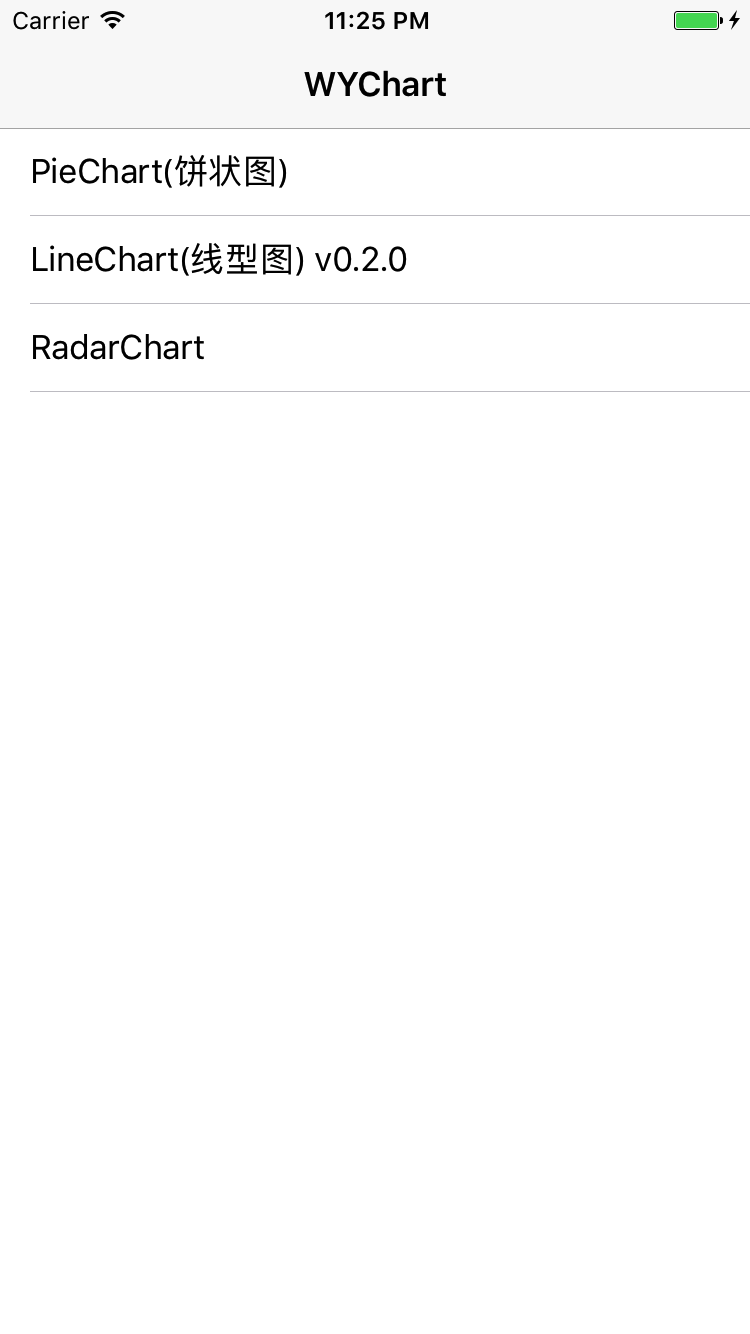
Main Table

Pie Chart Setting Page

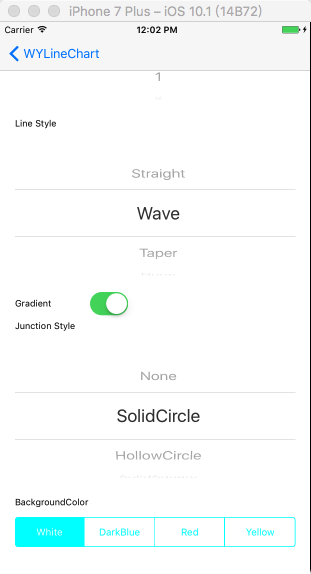
Line Chart Setting Page
Getting Started
Installation
WYChart is available through CocoaPods. To install it, simply add the following line to your Podfile:
pod "WYChart"Add floder
Just dragging the WYChart floder in your download project into you own project.
Setup
WYChart design the interface like most Controls in UIKit.framework, such as UITableView, UICollection, you have to implemente the required delegate and dataSource method, and setting some essential property.
First of all
Add the following line to you .h or .m file where you use the chart:
#import "WYLineChart.h"or
#import "WYPieChart.h"The follow lines will show you how to initialize WYLineChart and WYPieChart in different way.
WYLineChart
First, and following line to follow WYLineChartViewDelegate and WYLineChartViewDataSource:
@interface SomeViewController () <WYLineChartViewDelegate, WYLineChartViewDatasource>
Second, initilize instance for WYLineChartView:
    _chartView = [[WYLineChartView alloc] initWithFrame:frame];
    _chartView.delegate = self;
    _chartView.datasource = self;
Third, set the line chart data array, which contained numbers of WYLineChartPoint:
NSMutableArray *mutableArray = [NSMutableArray array];
// line_1
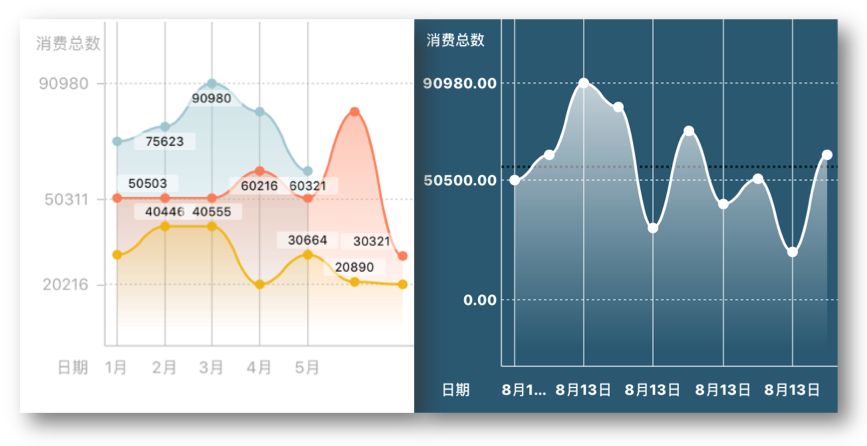
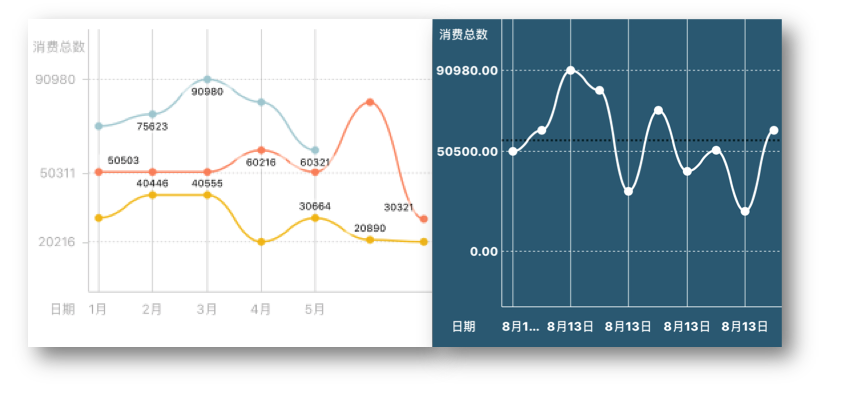
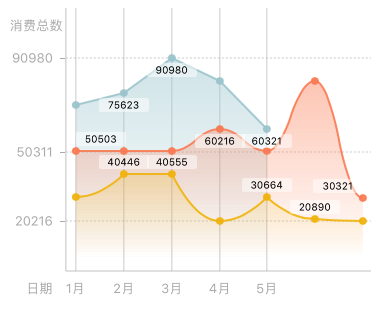
NSArray *points = [WYLineChartPoint pointsFromValueArray:@[@(70706.89),@(75623.4),@(90980.f),@(80890.34),@(60321.2)]];
[mutableArray addObject:points];
// line_2
points = [WYLineChartPoint pointsFromValueArray:@[@(50503.134),@(50446.85),@(50555.67),@(60216.48),@(50664.45),@(80890.34),@(30321.2)]];
[mutableArray addObject:points];
// set data
_lineChart.points = mutableArray;
after v0.2.0, lineChart.points containt mutiple lines` point, so data struct did changed, as describing in Headerfile WYLineChartView.h :
    // all the points of lines on the graph
    // the content should be:
    // /* points */@[
    //                  /* line 0 */ @[
    //                                 /* point 0 */ (WYLineChartPoint *)point0, point1, point2 ...
    //                                 ],
    //                  /* line 1 */ @[
    //                                 /* point 0 */ (WYLineChartPoint *)point0, point1, point2 ...
    //                                 ],
    //              ]
    // v0.2.0
Finally, add chart to controller`s view and update line chart:
    [self.view addSubview:_chartView];
    [_chartView updateGraph];
Besides, you have to implement the required methods of delegate and dataSource:
Delegate
- (CGFloat)gapBetweenPointsHorizontalInLineChartView:(WYLineChartView *)chartView;
DataSource
    - (NSString *)lineChartView:(WYLineChartView *)chartView contentTextForXAxisLabelAtIndex:(NSInteger)index

    - (WYLineChartPoint *)lineChartView:(WYLineChartView *)chartView pointReferToXAxisLabelAtIndex:(NSInteger)index
The jobs above is not enough, there are a lot of optional property for you to config the appearence and interaction of line chart. By the way, after v0.2.0, we used dictionary(key-value pairs) to config lines` attributes through dataSrouce methor - (NSDictionary *)lineChartView:(WYLineChartView *)chartView attributesForLineAtIndex:(NSUInteger)index; , so, some attribute such as line style if you plan to config it you have to implement the dataSource methor above.
Gradient Foreground
Gradient Foreground is a optional line attibute, you should use it by kWYLineChartLineAttributeDrawGradient key in dataSource methor.
To make the line chart more elegant, you can choose to add gradient foreground for it, add the following lines:
- (NSDictionary *)lineChartView:(WYLineChartView *)chartView attributesForLineAtIndex:(NSUInteger)index {
NSMutableDictionary *resultAttributes = [NSMutableDictionary dictionary];
resultAttributes[kWYLineChartLineAttributeDrawGradient] = @YES;

...
// other line attributes config
...

return resultAttributes;
}
After v0.2.0, there`s no need to set gradient color, because it is coincident with line`s color, so we just decide weather the gradient should showing.
That will show you a gradient foreground as following:
Gradient Foreground
Otherwise:
Without Gradient Foreground
Scrollabel
WYLineChart support you to scroll to chart horizontally, just add the simple line following:
_chartView.scrollable = YES;
Then, you can scroll the chart:

Scroll Chart
Pinchable
You can also add the following line:
_chartView.pinchable = YES;
to make the chart pinchable, that`s useful when you want to scale the data grade for chart to show, you can pinch out or pinch in to reload data, and the method - (void)lineChartView:didEndedPinchGraphWithOption: will be notified, in which you can reset the data array and update the chart.
Line Style
LineStyle is a optional lines` attribute, you should use it by kWYLineChartLineAttributeLineStyle key in dataSource methor.
WYLineChart supports three line style:
    kWYLineChartMainStraightLine,
    kWYLineChartMainBezierWaveLine,
    kWYLineChartMainBezierTaperLine
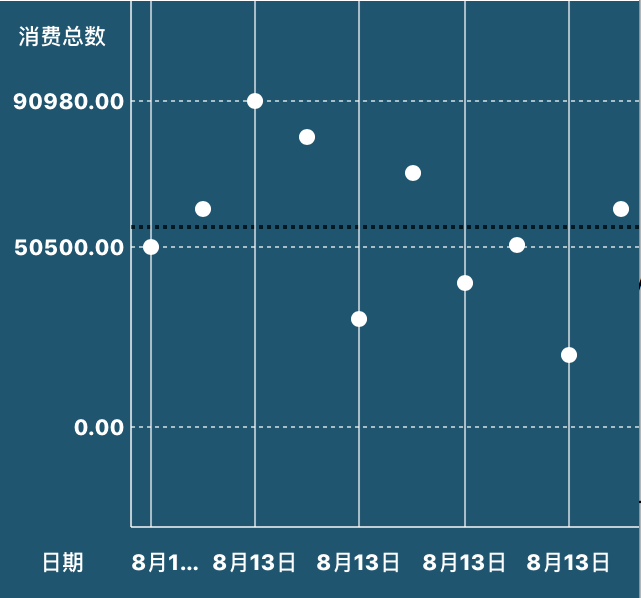
and if you do not want a line while just some point, you can choose kWYLineChartMainNoneLine for the kWYLineChartLineAttributeLineStyle key in the dataRouce methor.
Wave Style
Straight Style
Tapper Style
Wave, straight, tapper Style
None Line
Animation Style
Animation is not a line attribute, it`s a lineChart attribute, once be setted, all line are coincident. There are several animation for chart:
    kWYLineChartAnimationDrawing,
    kWYLineChartAnimationAlpha,
    kWYLineChartAnimationWidth,
    kWYLineChartAnimationRise,
    kWYLineChartAnimationSpring,
    kWYLineChartNoneAnimation
For example, kWYLineChartAnimationDrawing show as:

Drawing Animation
and kWYLineChartAnimationSpring show as:

Spring Animation
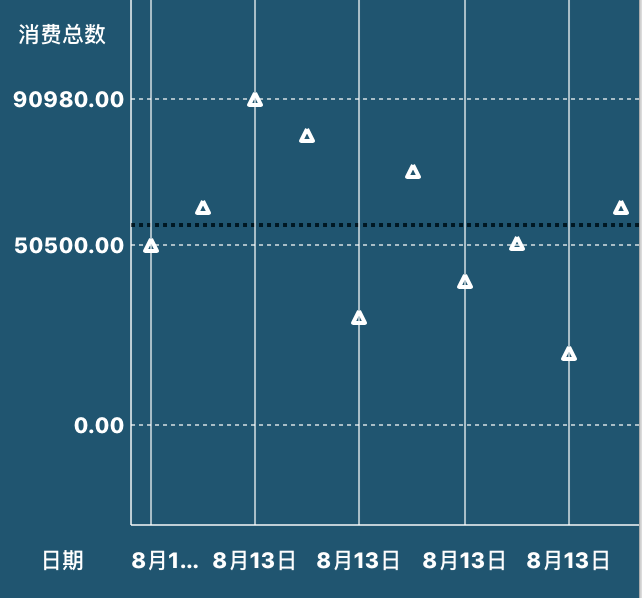
JunctionStyle is a optional line attribute, you should use it by kWYLineChartLineAttributeJunctionStyle key in dataSource methor.
You can choose a junction style bellowing:
    kWYLineChartJunctionShapeNone,
    kWYLineChartJunctionShapeSolidCircle,
    kWYLineChartJunctionShapeHollowCircle,
    kWYLineChartJunctionShapeSolidSquare,
    kWYLineChartJunctionShapeHollowSquare,
    kWYLineChartJunctionShapeSolidRectangle,
    kWYLineChartJunctionShapeHollowRectangle,
    kWYLineChartJunctionShapeSolidStar,
    kWYLineChartJunctionShapeHollowStar
For example, kWYLineChartJunctionShapeHollowRectangle will show as:
Hollow Rectangle
Touch Point/Line
WYLineChart containe a long press gesture for a point to show where you touch on the line, and will return the point by the delegate method bellow:
    - (void)lineChartView:didBeganTouchAtSegmentOfPoint:value:
    - (void)lineChartView:didMovedTouchToSegmentOfPoint:value:
    - (void)lineChartView:didEndedTouchToSegmentOfPoint:value:

Touch Point
But, after v0.2.0, this property work only if there just a single line in lineChartView.
Points` Label
After v0.2.0, it support you to customized a label to show nearby a point.
Just implement dataSource metohr - (NSString *)lineChartView:(WYLineChartView *)chartView contextTextForPointAtIndexPath:(NSIndexPath *)indexPath, if you return nil, the label at indexPath will no show.
There`re numbers of feature in WYLineChart, if you are intrested in it, see the interface and define file.
WYPieChart
First, and following line to follow WYPieChartViewDelegate and WYPieChartViewDataSource:
@interface SomeViewController () <WYLineChartViewDelegate, WYLineChartViewDatasource>
Second, initilize instance for WYPieChartView:
    _pieView = [[WYPieChartView alloc] initWithFrame:CGRectMake(0, 70, self.view.wy_boundsWidth, 300)];
    _pieView.delegate = self;
    _pieView.datasource = self;
Third, set the pie chart data array, which contained numbers of pie`s value:
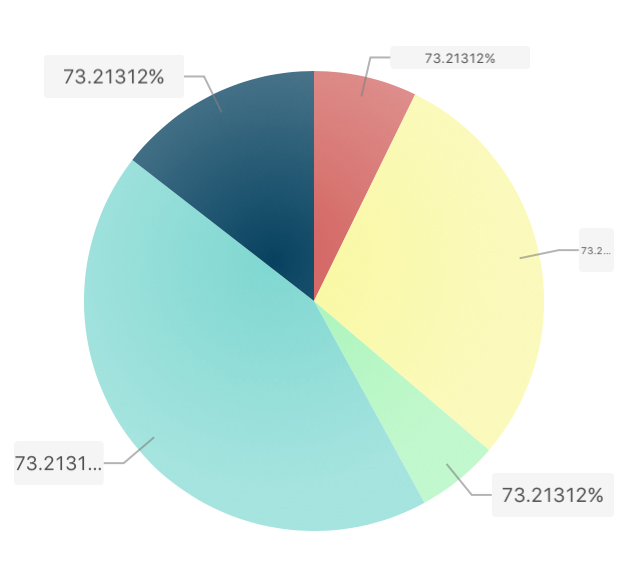
_pieView.values = @[@50, @200, @40, @300, @100];
Finally, add chart to controller`s view and update pie chart:
    [self.view addSubview:_pieView];
    [_pieView update];
Besides, colors for sector is required by dataSource method - (UIColor *)pieChartView:sectorColorAtIndex:, you have to implement that method to dye your pieChart.
Like WYLineChart, there are also number of optional property for you to config the appearence and interaction of line chart.
Pie Style
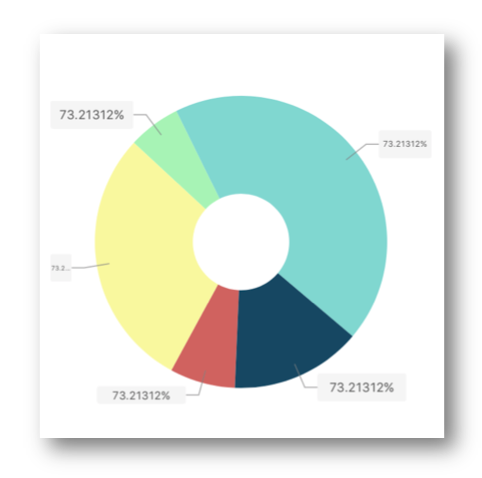
You can choose style between kWYPieChartNormalStyle and kWYPieChartGearStyle, as showing below:
Normal Pie Style
Gear Pie Style
Just add the following line when you initialize the pie chart:
_pieView.style = kWYPieChartNormalStyle/kWYPieChartGearStyle;
Rotatable
If you want the pie chart to be more interactable, you can add the code below:
_pieView.rotatable = YES;
to make it rotatable.
Pie Chart Rotatable
Selected
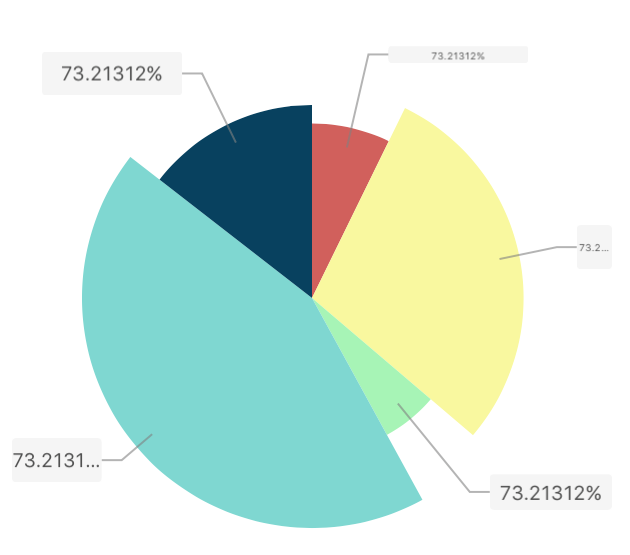
WYPieChart support you to select the sectors with two types of animation, and will call back to the delegate method pieChartView:didSelectedSectorAtIndex: when you selecting, you can choose selected type between kWYPieChartSectorSelectedExtraction and kWYPieChartSectorSelectedPull as below:
_pieView.selectedStyle = kWYPieChartSectorSelectedExtraction;

Extraction Style
Pull Style
Animation Style
Six styles of animation you can choose to animation the pie chart when reloading:
kWYPieChartAnimationOrderlySpreading,
kWYPieChartAnimationAllSpreading,
kWYPieChartAnimationStretching,
kWYPieChartAnimationAlpha,
kWYPieChartAnimationScale
For example, kWYPieChartAnimationAllSpreading style will show as below:

All Spreading Style
You can select the other animation styles to see what it perform in the demo.
Inner Circle
The property showInnerCircle is define should a empty circle draw in the chart, which you can add a label on it, such as a sum label.
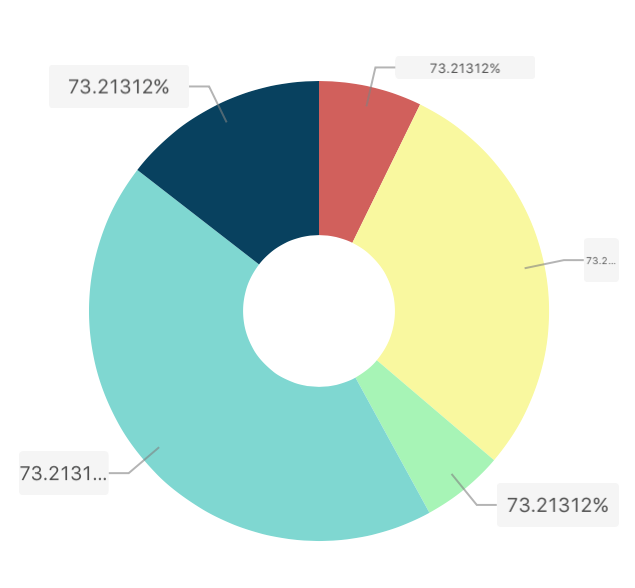
Inner Circle
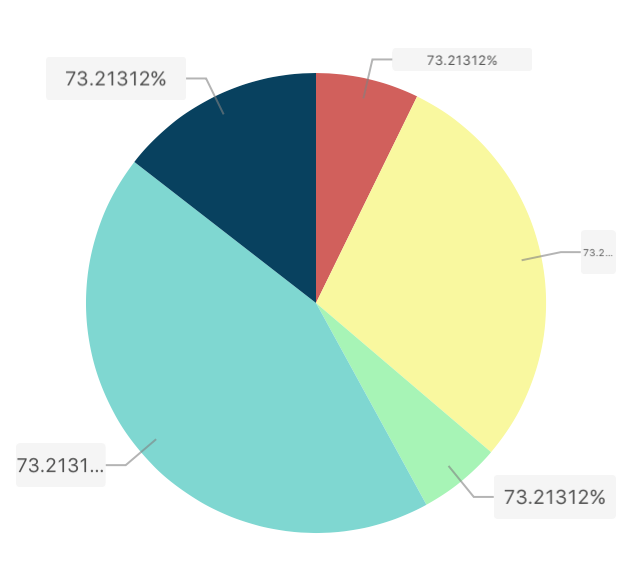
Gradient
The fillByGradient property default is NO, if you set it to YES, every sector will fill by gradient.
Gradient Fill
Some other feature also include in WYPieChart, you can find them in PieChartView.h
WYRadarChart
First, make a class confirm to protocal WYRadarChartViewDataSource
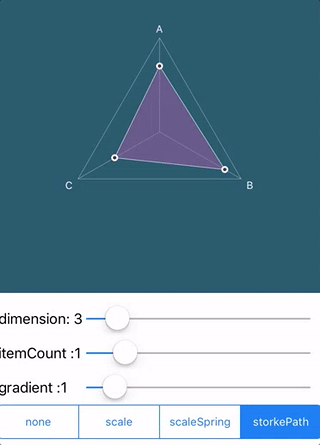
@interface SomeClass <WYRadarChartViewDataSource>Second, construct an array of WYRadarChartDimension, which descript the corner of the polygon in WYRadarChartView.
self.dimensions = [NSMutableArray new];
for (NSInteger index = 0; index < self.dimensionCount; index++) {
    WYRadarChartDimension *dimension = [WYRadarChartDimension new];
    dimension.title = @"title";
    dimension.titleColor = [UIColor whiteColor];
    [self.dimensions addObject:dimension];
}
Third create the WYRadarChartView with dimension array and set the dataSource.
self.radarChartView = [[WYRadarChartView alloc] initWithFrame:CGRectMake(0, 0, 100,100)
                                                   dimensions:self.dimensions
                                                     gradient:1];
self.radarChartView.dataSource = self;
Final, you can change the UI of WYRadarChartView, such as
gradient(determines the circle amount, 1 at least), lineWidth, lineColor. Then reload with reloadData or reloadDataWithAnimation:duration:
dimension
Radar chart view must be created with dimension array.
dimension
Item
Get item data from datasource and config UI style for WYRadarChartItem
self.items = [NSMutableArray new];
for (NSInteger index = 0; index < self.itemCount; index++) {
    WYRadarChartItem *item = [WYRadarChartItem new];
    NSMutableArray *value = [NSMutableArray new];
    for (NSInteger i = 0; i < self.dimensionCount; i++) {
        [value addObject:@(arc4random_uniform(100)*0.01)];
    }
    item.value = value;
    item.borderColor = [UIColor wy_colorWithHex:0xffffff];
    item.fillColor = [UIColor wy_colorWithHex:arc4random_uniform(0xffffff) alpha:0.5];
    item.junctionShape = kWYLineChartJunctionShapeSolidCircle;
    [self.items addObject:item];
}

#pragma mark - WYRadarChartViewDataSource

- (NSUInteger)numberOfItemInRadarChartView:(WYRadarChartView *)radarChartView {
    return self.items.count;
}

- (WYRadarChartItem *)radarChartView:(WYRadarChartView *)radarChartView itemAtIndex:(NSUInteger)index {
    return self.items[index];
}

- (id<WYRadarChartViewItemDescription>)radarChartView:(WYRadarChartView *)radarChartView descriptionForItemAtIndex:(NSUInteger)index {
    return nil;
}
Item
Gradient
self.radarChartView.gradient = self.gradient;
[self.radarChartView reloadDataWithAnimation:self.animation duration:kAnimationDuration];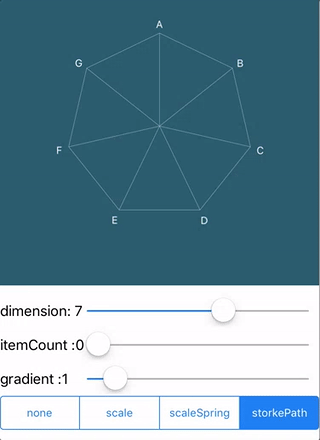
Gradient
Animation
reload with aniamtion and animation duration.
typedef NS_ENUM(NSUInteger, WYRadarChartViewAnimation) {
    WYRadarChartViewAnimationNone,
    WYRadarChartViewAnimationScale,
    WYRadarChartViewAnimationScaleSpring,
    WYRadarChartViewAnimationStrokePath
};

[self.radarChartView reloadDataWithAnimation:self.animation duration:kAnimationDuration];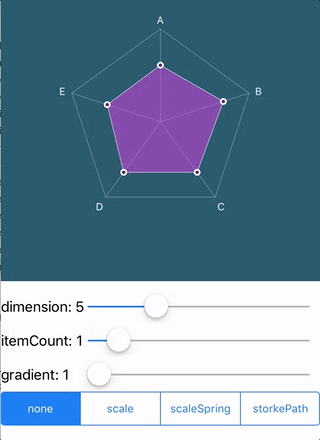
All Spreading Style
Junction Style
You can config the junctionShape property of WYRadarChartItem with the same style in JunctionStyle of WYLineChart
/*
 *  default is kWYLineChartJunctionShapeNone
 */
@property (nonatomic, assign) WYLineChartJunctionShapeStyle junctionShape;
Features
v0.3.0
- Including radar chart.
- Radar chart support mutiple dimensions and mutiple items.
- Radar chart including various animation such scale and stroke and so on.
v0.2.0
- Support multiple lines in a lineChart.
- Support label with custom text to show on every point nearby.
- Using Dictionary(key-value) to set lines` attribute instead of property.
v0.1.2
- Fix bug : WYPieChartView change values and update crash.
v0.1.1
- Fix bug : WYLineChartView, count of labels on X axis can`t be same to points` count.
v0.1.0 (First Release)
- Including line chart (with a single line) and pie chart.
- Line chart including various animation such as Drawing and Spring and more as above introduction.
- Line char including various line style such as bezierWaveLine, bezierTapLine and straightLine.
- Pie chart including tow pie style : normal round and gear.
- Pie chart including various animation such spring and scale and more as above introduction.
- Pie chart including tow interaction : rotate and drag.
Contact
If you have any problem or got an idear, i will be glad if share them to me by a #issue or [email protected], and this my personal blog where you can find some technology about WYChart or any other topics.