2GIS iOS MapGL

2GIS iOS MapGL is an SDK that allows you to add a 2GIS map to your iOS application. It can be used to display the map in your interface, add custom markers and labels to it, draw routes and custom shapes, and highlight various objects on the map, such as buildings, roads, and others.
This SDK uses WebKit to render the map. If you need a more native solution (for example, if you don't want to display web content inside your app), take a look at iOS Native SDK.
Full documentation, including more usage examples and detailed descriptions of all classes and methods, can be found at docs.2gis.com/en/ios/webgl/maps/overview.
Getting an access key
Usage of this SDK requires an API key to connect to 2GIS servers and retrieve the geographical data. This API key is unique to the SDK and cannot be used with other 2GIS SDKs. To obtain the key, contact us at [email protected].
Additionally, if you plan to draw routes on the map, you will need a separate key—a Directions API key—to calculate and display an optimal route. To get it, fill the form at partner.api.2gis.ru or contact us at [email protected].
Installation
2GIS iOS MapGL is available through CocoaPods. To install it, add the following line to your Podfile:
pod 'MapGL'Usage
To run the example app, open HelloSDK.xcworkspace and specify your API keys in Example/HelloSDK/HelloVC.swift:
enum Constants {
    static let apiKey = "YOUR_MAPGL_KEY"
    static let directionsApiKey = "YOUR_DIRECTIONS_KEY"
}
Creating a map widget
To display a map, first add a MapView to your interface. MapView is inherited from UIView, therefore you can use Storyboards, XIBs, or create it programmatically:
let map = MapView(frame: CGRect(x: 0, y: 0, width: 100, height: 100))Then, initialize the widget by calling the show() method and passing your API key. You can also pass the initial coordinates and the required zoom level. See the API Reference for the full list of options.
For example, the following code will show the map of Moscow centered around the Kremlin:
map.show(
    apiKey: "Your API key",
    center: CLLocationCoordinate2D(latitude: 55.7516, longitude: 37.6179),
    zoom: 16
)
To do something after the map has been initialized, you can write a trailing closure:
map.show(apiKey: "Your API key") { _ in
    // closure body
}
Adding a marker
You can add any number of markers to a map. To add a marker, instantiate the Marker class and pass the object to the add() method after the map was initialized. The only required parameter is the coordinates of the marker.
map.show(apiKey: "Your API key") { _ in
    let marker = Marker(coordinates: CLLocationCoordinate2D(latitude: 55.7516, longitude: 37.6179))
    map.add(marker)
}
Additionally, you can change the marker's appearance. You can specify the image (as UIImage) and the anchor (where the image's hotspot should be located). See the API Reference for more information on how to specify the anchor.

let marker = Marker(
    coordinates: CLLocationCoordinate2D(latitude: 55.7516, longitude: 37.6179),
    image: UIImage(named: "pin")!,
    anchor: .bottom
)
To toggle marker visibility, you can use the methods hide() and show():
marker.hide()
marker.show()
Adding a label
You can add multiple text labels to a map. To add a label, instantiate the Label class by specifying the coordinates, the label text, the text color (as UIColor), and the font size. Then, pass the resulting object to the add() method of the map:
map.show(apiKey: "Your API key") { _ in
    let label = Label(
        center: CLLocationCoordinate2D(latitude: 55.7517, longitude: 37.6179),
        text: "The Kremlin label",
        color: .white,
        fontSize: 14
    )
    map.add(label)
}
To hide the label, you can use the hide() method. To show it again, use the show() method.
label.hide()
label.show()
Drawing custom shapes
Apart from image markers and text labels, you can draw custom shapes on a map, such as lines, circles and polygons. For each shape, you need to specify the coordinates and colors. Additionally, you can specify the Z-order to layer the shapes over one another.
Drawing a line
To draw a line on a map, instantiate the Polyline class and pass the resulting object to the add() method of the map.
Polyline takes two types of parameters: coordinates of line points (array of CLLocationCoordinate2D) and up to three PolylineStyle objects to stylize the line.
To put it simply, a line can consist of up to three sub-lines drawn under each other. Each subline is customized by a separate parameter (style1 for the topmost subline, style2 for the middle subline, and style3 for the bottommost subline). style2 and style3 can be omitted to draw a line without sublines.
For example, to draw a simple line between two points, you can use code similar to the following:
let polyline = Polyline(
    points: [
        CLLocationCoordinate2D(latitude: 55.752164, longitude: 37.615487),
        CLLocationCoordinate2D(latitude: 55.751691, longitude: 37.621339)
    ],
    style1: PolylineStyle(color: .blue, width: 5)
)
map.add(polyline)
As a more complex example, to draw a line connecting several points and consisting of three sub-lines, you can use the following code:
let polyline = Polyline(
    points: [
        CLLocationCoordinate2D(latitude: 37.615104, longitude: 55.752375),
        CLLocationCoordinate2D(latitude: 37.618022, longitude: 55.752459),
        CLLocationCoordinate2D(latitude: 37.615189, longitude: 55.750829),
        CLLocationCoordinate2D(latitude: 37.617936, longitude: 55.750865)
    ],
    style1: PolylineStyle(color: .blue, width: 6),
    style2: PolylineStyle(color: .white, width: 10),
    style3: PolylineStyle(color: .black, width: 12)
)
map.add(polyline)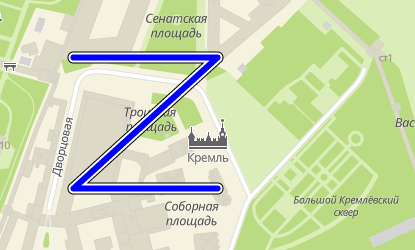
In this example, there is a white line drawn underneath the blue line, and a black line drawn underneath the white line. Together they create a line with a double stroke effect.
Drawing a circle
To draw a circle on a map, instantiate the Circle class and pass the resulting object to the add() method of the map.
Circle takes several parameters. To specify the center coordinates and size of the circle, specify center and radius (in meters) respectively. To specify fill color, use fillColor (as UIColor). To specify stroke color and width, use strokeColor and strokeWidth. Finally, to specify the Z-order, use the z parameter.
let circle = Circle(
    center: CLLocationCoordinate2D(latitude: 55.7516, longitude: 37.6179),
    radius: 100,
    fillColor: UIColor.blue.withAlphaComponent(0.2),
    strokeColor: .blue,
    strokeWidth: 2,
    z: 5
)
map.add(circle)
Drawing a polygon
To draw a polygon on a map, instantiate the Polygon class and pass the resulting object to the add() method of the map.
Polygon takes several parameters. To specify the coordinates of polygon vertices, specify the points parameter as an array of CLLocationCoordinate2D. To specify fill color, use fillColor (as UIColor). To specify stroke color and width, use strokeColor and strokeWidth. Finally, to specify the Z-order, use the z parameter.
let polygon = Polygon(
    points: [
        CLLocationCoordinate2D(latitude: 55.7526, longitude: 37.6179),
        CLLocationCoordinate2D(latitude: 55.7506, longitude: 37.6161),
        CLLocationCoordinate2D(latitude: 55.7506, longitude: 37.6197)
    ],
    fillColor: UIColor.blue.withAlphaComponent(0.2),
    strokeColor: .blue,
    strokeWidth: 2,
    z: 5
)
map.add(polygon)
Handling touch events
To receive touch coordinates, you can register a click listener on the map:
map.mapClick = { coordinates in
    let latitude = coordinates.latitude
}
To get the ID of the tapped object (building, road, marker, custom shape, etc.), implement the optional method of the MapViewDelegate protocol:
func mapView(_ mapView: MapView, didSelectObject object: MapObject) {
    let objectId = object.id
}
You can then use the ID of an object to highlight that object on the map (see Highlighting objects). The same ID can also be used to get full information about the object via the Places API, since the IDs are the same for all APIs.
Highlighting objects
You can highlight map objects, such as buildings, roads, and others.
To do that, call the setSelectedObjects() method and pass an array of IDs of the objects that need to be highlighted. You can get the IDs by adding a click listener to the map (see the Handling touch events section).
map.setSelectedObjects(["48231504731808815", "23520539192555249"])
To change the list of highlighted objects, simply call this method again, passing the array of new IDs.
To disable highlighting, pass an empty array to the setSelectedObjects() method:
map.setSelectedObjects([])Routes
If you have a Directions API key, you can draw routes on a map.
To draw a route, first create a Directions object by calling the makeDirections() method and passing your key:
let directions = map.makeDirections(with: "Your Directions API key")Then, you can call the showCarRoute() method and pass an array of up to 10 coordinates to calculate and display an optimal route:
directions.showCarRoute(points: [
    CLLocationCoordinate2D(latitude: 55.746069, longitude: 37.622074),
    CLLocationCoordinate2D(latitude: 55.747313, longitude: 37.615573)
])
To hide the route, call the clear() method:
directions.clear()License
2GIS iOS MapGL is licensed under the BSD 2-Clause "Simplified" License. See the LICENSE file for more information.