
Introduction
LLDebugTool is a debugging tool for developers and testers that can help you analyze and manipulate data in non-xcode situations.
LLDebugToolSwift is the extension of LLDebugTool, it provide swift interface for LLDebugTool, LLDebugToolSwift will release with LLDebugTool at same time.
If your project is a Objective-C project, you can use LLDebugTool, if your project is a Swift project or contains swift files, you can use LLDebugToolSwift.
Choose LLDebugTool for your next project, or migrate over your existing projects—you'll be happy you did!
Gif
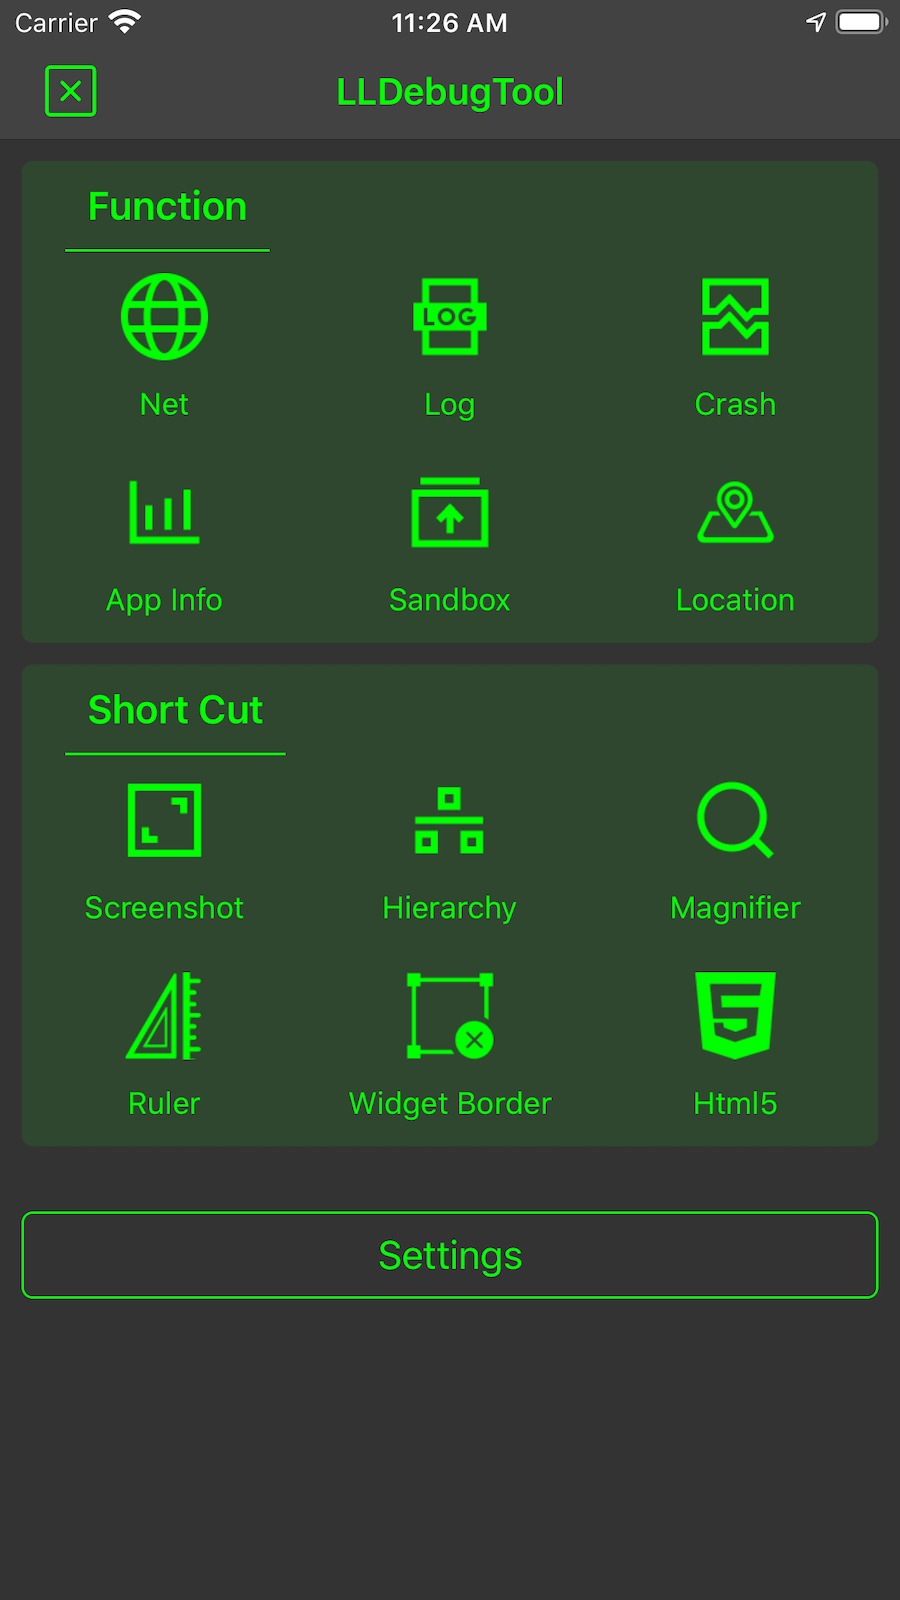
Preview
What's new in 1.3.8.1
Remove auto check version.
- Too many visits to the website
cocoadocs.orgcausecocoadocs.orgto disable the access toLLDebugTool, so this function is removed.
What can you do with LLDebugTool?
-
Always check the network request or view log information for certain events without having to run under XCode. This is useful in solving the testers' problems.
-
Easier filtering and filtering of useful information.
-
Easier analysis of occasional problems.
-
Easier analysis of the cause of the crash.
-
Easier sharing, previewing, or removing sandbox files, which can be very useful in the development stage.
-
Easier observe app's memory, CPU, FPS and other information.
-
Take screenshots, tag and share.
-
More intuitive view of view structure and dynamic modify properties.
-
Determine UI elements and colors in your App more accurately.
-
Easy access to and comparison of point information.
-
Easy access to element borders and frames.
-
Quick entry for html.
-
Mock location at anytime.
Adding LLDebugTool to your project
CocoaPods
CocoaPods is the recommended way to add LLDebugTool to your project.
Objective - C
- Add a pod entry for LLDebugTool to your Podfile
pod 'LLDebugTool' , '~> 1.0'.- If only you want to use it only in Debug mode, Add a pod entry for LLDebugTool to your Podfile
pod 'LLDebugTool' , '~> 1.0' ,:configurations => ['Debug'], Details also see Wiki/Use in Debug environment. If you want to specify the version, use aspod 'LLDebugTool' , '1.3.8.1' ,:configurations => ['Debug'].- The recommended approach is to use multiple targets and only add
pod 'LLDebugTool', '~> 1.0'to Debug Target. This has the advantage of not contamiling the code in the Product environment and can be integrated into the App in the Archive Debug environment (if:configurations => ['Debug'], it can only run through XCode. It is not possible to Archive as an App).- Install the pod(s) by running
pod install. If you can't searchLLDebugToolor you can't find the newest release version, runningpod repo updatebeforepod install.- Include LLDebugTool wherever you need it with
#import "LLDebug.h"or you can write#import "LLDebug.h"in your .pch in your .pch file.
Swift
- Add a pod entry for LLDebugToolSwift to your Podfile
pod 'LLDebugToolSwift' , '~> 1.0'.- If only you want to use it only in Debug mode, Add a pod entry for LLDebugToolSwift to your Podfile
pod 'LLDebugToolSwift' , '~> 1.0' ,:configurations => ['Debug'], Details also see Wiki/Use in Debug environment. If you want to specify the version, use aspod 'LLDebugToolSwift' , '1.3.8.1' ,:configurations => ['Debug'].- The recommended approach is to use multiple targets and only add
pod 'LLDebugToolSwift', '~> 1.0'to Debug Target. This has the advantage of not contamiling the code in the Product environment and can be integrated into the App in the Archive Debug environment (if:configurations => ['Debug'], it can only run through XCode. It is not possible to Archive as an App).- Must be added in the Podfile
use_frameworks!.- Install the pod(s) by running
pod install. If you can't searchLLDebugToolSwiftor you can't find the newest release version, runningpod repo updatebeforepod install.- Include LLDebugTool wherever you need it with
import "LLDebugToolSwift.
Carthage
Carthage is a decentralized dependency manager that builds your dependencies and provides you with binary frameworks.
Objective - C
To integrate LLDebugTool into your Xcode project using Carthage, specify it in your
Cartfile:
github "LLDebugTool"Run
carthageto build the framework and drag the builtLLDebugTool.frameworkinto your Xcode project.
Swift
To integrate LLDebugToolSwift into your Xcode project using Carthage, specify it in your
Cartfile:
github "LLDebugToolSwift"Run
carthageto build the framework and drag the builtLLDebugToolSwift.frameworkinto your Xcode project.
Source files
Alternatively you can directly add the source folder named LLDebugTool. to your project.
Objective - C
- Download the latest code version or add the repository as a git submodule to your git-tracked project.
- Open your project in Xcode, then drag and drop the source folder named
LLDebugTool. When you are prompted to "Choose options for adding these files", be sure to check the "Copy items if needed".- Integrated FMDB to your project,FMDB is an Objective-C wrapper around SQLite.
- Integrated Masonry to your project, Masonry is an Objective-C constraint library. There are no specific version requirements, but it is recommended that you use the latest version.
- Include LLDebugTool wherever you need it with
#import "LLDebug.h"or you can write#import "LLDebug.h"in your .pch in your .pch file.
Swift
- Download the LLDebugTool latest code version or add the repository as a git submodule to your git-tracked project.
- Download the LLDebugToolSwift latest code version or add the repository as a git submodule to your git-tracked project.
- Open your project in Xcode, then drag and drop the source folder named
LLDebugToolandLLDebugToolSwift. When you are prompted to "Choose options for adding these files", be sure to check the "Copy items if needed".- Integrated FMDB to your project,FMDB is an Objective-C wrapper around SQLite.
- Integrated Masonry to your project, Masonry is an Objective-C constraint library. There are no specific version requirements, but it is recommended that you use the latest version.
- Include LLDebugTool wherever you need it with
import LLDebugToolSwift".
Usage
Get Started
You need to start LLDebugTool at "application:(UIApplication * )application didFinishLaunchingWithOptions:(NSDictionary * )launchOptions", Otherwise you will lose some information.
If you want to configure some parameters, must configure before "startWorking". More config details see LLConfig.h.
Quick Start
In Objective-C
#import "AppDelegate.h"
#import "LLDebug.h"

- (BOOL)application:(UIApplication *)application didFinishLaunchingWithOptions:(NSDictionary *)launchOptions {
    // The default color configuration is green background and white text color.

    // Start working.
    [[LLDebugTool sharedTool] startWorking];

    // Write your project code here.
    return YES;
}
In Swift
import LLDebugToolSwift

    func application(_ application: UIApplication, didFinishLaunchingWithOptions launchOptions: [UIApplicationLaunchOptionsKey: Any]?) -> Bool {
        // ####################### Start LLDebugTool #######################//
        // Use this line to start working.
        LLDebugTool.shared().startWorking()

        // Write your project code here.

        return true
    }
Start With Custom Config
In Objective-C
#import "AppDelegate.h"
#import "LLDebug.h"

- (BOOL)application:(UIApplication *)application didFinishLaunchingWithOptions:(NSDictionary *)launchOptions {

    // Start working with config.
    [[LLDebugTool sharedTool] startWorkingWithConfigBlock:^(LLConfig * _Nonnull config) {

        //####################### Color Style #######################//
        // Uncomment one of the following lines to change the color configuration.
        // config.colorStyle = LLConfigColorStyleSystem;
        // [config configBackgroundColor:[UIColor orangeColor] primaryColor:[UIColor whiteColor] statusBarStyle:UIStatusBarStyleDefault];

        //####################### User Identity #######################//
        // Use this line to tag user. More config please see "LLConfig.h".
        config.userIdentity = @"Miss L";

        //####################### Window Style #######################//
        // Uncomment one of the following lines to change the window style.
        // config.entryWindowStyle = LLConfigEntryWindowStyleNetBar;

    }];

    return YES;
}
In Swift
import LLDebugToolSwift

    func application(_ application: UIApplication, didFinishLaunchingWithOptions launchOptions: [UIApplicationLaunchOptionsKey: Any]?) -> Bool {

        // Start working with config.
        LLDebugTool.shared().startWorking { (config) in
            //####################### Color Style #######################//
            // Uncomment one of the following lines to change the color configuration.
            // config.colorStyle = .system
            // config.configBackgroundColor(.orange, textColor: .white, statusBarStyle: .default)

            //####################### User Identity #######################//
            // Use this line to tag user. More config please see "LLConfig.h".
            config.userIdentity = "Miss L";

            //####################### Window Style #######################//
            // Uncomment one of the following lines to change the window style.
            // config.windowStyle = .netBar

            //####################### Features #######################//
            // Uncomment this line to change the available features.
            // config.availables = .noneAppInfo
        }

        return true
    }
Network Request
You don't need to do anything, just call the "startWorking" will monitoring most of network requests, including the use of NSURLSession, NSURLConnection and AFNetworking. If you find that you can't be monitored in some cases, please open an issue and tell me.
Log
Print and save a log. More log macros details see LLDebugToolMacros.h.
Save Log
In Objective-C
#import "LLDebug.h"

- (void)testNormalLog {
    // Insert an LLog where you want to print.
    LLog(@"Message you want to save or print.");
}
In Swift
import LLDebugToolSwift

    func testNormalLog() {
        // Insert an LLog where you want to print.
        LLog.log(message: "Message you want to save or print.")
    }
Save Log with event and level
In Objective-C
#import "LLDebug.h"

- (void)testEventErrorLog {
    // Insert an LLog_Error_Event where you want to print an event and level log.
    LLog_Error_Event(@"The event that you want to mark. such as bugA, taskB or processC.",@"Message you want to save or print.");
}
In Swift
import LLDebugToolSwift

    func testEventErrorLog() {
        // Insert an LLog_Error_Event where you want to print an event and level log.
        LLog.errorLog(message: "Message you want to save or print.", event: "The event that you want to mark. such as bugA, taskB or processC.")
    }
Crash
You don't need to do anything, just call the "startWorking" to intercept the crash, store crash information, cause and stack informations, and also store the network requests and log informations at the this time.
AppInfo
LLDebugTool monitors the app's CPU, memory, and FPS. At the same time, you can also quickly check the various information of the app.
Sandbox
LLDebugTool provides a quick way to view and manipulate sandbox, you can easily delete the files/folders inside the sandbox, or you can share files/folders by airdrop elsewhere. As long as apple supports this file format, you can preview the files directly in LLDebugTool.
Screenshots
LLDebugTool provides a screenshot and allows for simple painting and marking that can be easily recorded during testing or while the UI designers debugs the App.
Hierarchy
LLDebugTool provides a view structure tool for viewing or modify elements' properties and information in non-debug mode.
Magnifier
LLDebugTool provides a magnify tool for magnifying local uis and viewing color values at specified pixel.
Ruler
LLDebugTool provides a convenient tools to display touch point information.
Widget Border
LLDebugTool provides a function to display element border, convenient to see the view's frame.
HTML
LLDebugTool can debug HTML pages through WKWebView, UIWebView or your customized ViewController in your app at any time.
Location
LLDebugTool provides a function to mock location at anytime.
More Usage
- You can get more help by looking at the Wiki.
- You can download and run the LLDebugToolDemo or LLDebugToolSwiftDemo to find more use with LLDebugTool. The demo is build under MacOS 10.15.1, XCode 11.2.1, iOS 13.2.2, CocoaPods 1.8.4. If there is any version compatibility problem, please let me know.
Requirements
LLDebugTool works on iOS 8+ and requires ARC to build. It depends on the following Apple frameworks, which should already be included with most Xcode templates:
-
UIKit -
Foundation -
SystemConfiguration -
Photos -
QuickLook -
CoreTelephony -
CoreLocation -
MapKit -
AVKit
Architecture
-
LLDebug.hPublic header file. You can refer it to the pch file.
-
DebugToolLLDebugToolUsed to start and stop LLDebugTool, you need to look at it.LLConfigUsed for the custom color , size , identification and other information. If you want to configure anything, you need to focus on this file.LLDebugToolMacros.hQuick macro definition file. -
ComponentsNetworkUsed to monitoring network request.LogUsed to quick print and save log.CrashUsed to collect crash information when an App crashes.AppInfoUse to monitoring app's properties.SandboxUsed to view and operate sandbox files.ScreenshotUsed to process and display screenshots.HierarchyUsed to process and present the view structure.MagnifierUsed for magnifying glass function.RulerUsed to ruler function.Widget BorderUser to widget border function.FunctionUsed to show functions.HtmlUsed to dynamic test web view.LocationUsed to mock location.SettingUsed to dynamically set configs.
Communication
- If you need help, open an issue.
- If you'd like to ask a general question, open an issue.
- If you found a bug, and can provide steps to reliably reproduce it, open an issue.
- If you have a feature request, open an issue.
- If you find anything wrong or anything dislike, open an issue.
- If you have some good ideas or some requests, send mail([email protected]) to me.
- If you want to contribute, submit a pull request.
Contact
- Send email to [email protected]
- Send message in twitter @HdbLi
- Send message in JianShu
Change-log
A brief summary of each LLDebugTool release can be found in the CHANGELOG.
License
This code is distributed under the terms and conditions of the MIT license.